
CMT has been involved in the Engine Combustion Network (ECN) since the very first workshop back in 2011. This is an international collaboration among experimental and computational researchers in engine combustion.
This research has been partly funded by the European Union’s Horizon 2020 Programme through the ENERXICO project, grant agreement n◦ 828947, and from the Mexican Department of Energy, CONACYT-SENER Hidrocarburos grant agreement n◦ B-S-69926.

CMT has been involved in the Engine Combustion Network (ECN) since the very first workshop back in 2011. This is an international collaboration among experimental and computational researchers in engine combustion. The central ECN website and repository can be found here.
This section summarizes some of the experimental activity carried out by CMT within this research framework:
- BOUNDARY CONDITIONS includes details on the nozzle geometry for Spray A, B and G, as well as the experimental methods to characterize injection performance and an assessment about the temperature uniformity in the CMT vessel.
- EXPERIMENTAL RESULTS gives some highlights on experiments. Main combustion parameters such as liquid length, vapor penetration, lift-off length and ignition delay have been investigated for the previously mentioned nozzles.
- DATA DOWLOAD allows you to download some of the experimental results, as well as the CMT 1D spray model.
The latest experimental results included here starting from May 2021 have been obtained within the H2020 Enerxico project. In particular, an experimental campaign with renewable fuels (HVO, OMEx, OME1 as well as reference dodecane and Diesel) has been carried out with Spray A and Spray D nozzles including high speed schlieren and OH* imaging, as well as Diffuse Back Illumination. The experimental methodology has been summarized here, and available data for download can be obtained here.

This research has been partly funded by the European Union’s Horizon 2020 Programme through the ENERXICO project, grant agreement n◦ 828947, and from the Mexican Department of Energy, CONACYT-SENER Hidrocarburos grant agreement n◦ B-S-69926.
Spray A
| Specifications for Spray A injectors of the Engine Combustion Network | |
|---|---|
| Common rail fuel injector | Bosch solenoid-activated, generation 2.4 |
| Fuel injector nominal nozzle outlet diameter | 0.090 mm |
| Nozzle K factor | K = (dinlet – doutlet)/10 [use μm] = 1.5 |
| Nozzle shaping | Smoothed by hydro-erosion |
| Mini-sac volume | 0.2 mm3 |
| Discharge coefficient at 10 MPa pressure drop | Cd = 0.86 (room temperature using diesel fuel) |
| Number of holes | 1 |
| Orifice orientation relative to injector axis | Axial (0º) |
Fuel injector and rail setup
- Common Rail: 22 cc volume and approximately 280 mm in length.
- Rail outlet farthest away from fuel entrance to rail (small orifice) must be used (i.e. cylinder #1).
- Length of tube from rail to injector inlet shall be 24 cm.
- Inner diameter of ducting shall be 2.4 mm. Outer diameter typically 6-6.4 mm. (This 24 cm tube is available for purchase from USUI Corporation, reference part number IFP01-0000094716. It is rated for 2500 bar pressure.)
- If using a high-speed pressure transducer for dynamic fuel pressure measurements, the transducer shall be mounted 7 cm away from the injector inlet.
Internal geometry
Internal shape of the nozzle has been extracted through silicone molds and SEM imaging1(injector serial number 675).
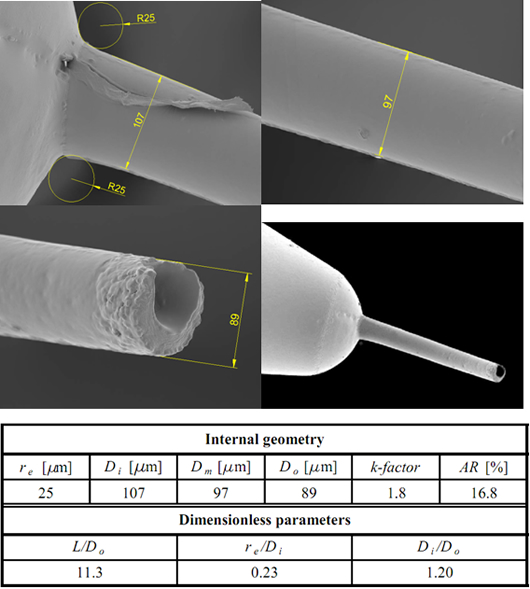
More information regarding the nozzle geometry can be found in
1 The experimental methodology is described in:
V. Macian, V. Bermúdez, R. Payri, J. Gimeno, New technique for the determination of the internal geometry of Diesel nozzle with the use of the silicone methodology, Experimental Techniques, Vol 27 (2), pp. 39-43, 2003. here
Spray B
| Specifications for Spray B injectors of the Engine Combustion Network | |
|---|---|
| Common rail fuel injector | Bosch solenoid-activated, generation 2.4 |
| Fuel injector nominal nozzle outlet diameter | 0.090 mm |
| Nozzle K factor | K = (dinlet – doutlet)/10 [use μm] = 1.5 |
| Nozzle shaping | Smoothed by hydro-erosion |
| Mini-sac volume | 0.2 mm3 |
| Discharge coefficient at 10 MPa pressure drop | Cd = 0.86 (room temperature using diesel fuel) |
| Number of holes | 3 |
| Hole angular position | θ = 36.4°, -62.3° and 180° |
| Orifice orientation relative to injector axis | ψ = 72.5° (145° full included angle) |

More information regarding the nozzle geometry can be found in here
Spray B
| Parameter | Specification Value |
|---|---|
| Number of holes | 8 |
| Inner diameter | 165 (µm) |
| Outer diameter | 388 (µm) |
| Spray shape | Circular |
| Spray angle | 80 (º) |
| Bend angle | 0 (º) |
| L/D ratio | 2 |
| Hole shape | Straight |
| Manufacturing | EDM |
| Flow rate | 15 (cc/s) @ 10 Mpa |
The hole of main interest is the one drilled opposite to the fuel tube (Hole #3). The nozzles have been designed so that the other sprays would not visually interfere with the spray of interest. Below is a schematic of the definition used for the hole orientation. The orientation angle θ represents the location of the orifice with respect to the axis of the fuel tube. The orientation angles given by the manufacturer are 36.4°, -62.3° and 180° for orifices 1, 2 and 3 respectively. Note that the orientation can also be expressed as φ, the angle used by the manufacturer with reference to two locator pins holding the nozzle in position with respect to the injector body. But these pins are not visible from outside (without unmounting the nozzle). For that reason, θ is defined as the angle between the fuel tube and the actual orifice in the counter clockwise direction when facing the injector tip.


Momentum flux
A purpose-designed test rig has been used to measure the momentum flux of the spray
- Piezo-electric sensor: Force sensor which directly measures the momentum flux.
- Pressurized with gas N2 (Maximum pressure in the chamber 80 bar).
- Continuous fuel purging system.
- Characterization of single-hole and multi-hole nozzles (Hole-to-hole dispersion can be evaluated).


- Momentum tests assumptions:
- Uniform chamber pressure
- Incoming air velocity perpendicular to axis
- Momentum does not depend on:
- Chamber pressure or density (steady)
- Measurement distance from orifice
The technique together with the experimental facility used to perform momentum flux measurements are described in:
R. Payri, J.M.Garcia, F.J. Salvador, J. Gimeno, Using spray momentum flux measurements to understand the influence of diesel nozzle geometry on spray characteristics, Fuel 84, p. 551-561, 2005.
Rate of injection (mass flux)
Injection pressure is regulated upstream of the rail to damp the pressure oscillations induced by the pump.
The electric signal used to command the injector is generated by a Genotec (Iopen= 18 A (450ms), Ihold= 12 A)
A commercial rate-meter has been used to record time-resolved mass flow rate.
- Bosch method (long tube): A pressure transducer records the ROI in an anechoic volume filled with the fuel injected.
- The total amount of fuel injected in each stroke was measured with a gravimetric balance to adjust the ROI signal.

The measuring methodology is described in:
R. Payri, F.J. Salvador, J. Gimeno, G. Bracho, A new methodology for correcting the signal cumulative phenomenon on injection rate measurements Experimental techniques. Volumen: 32 (1) pp. 46-49, 2008.
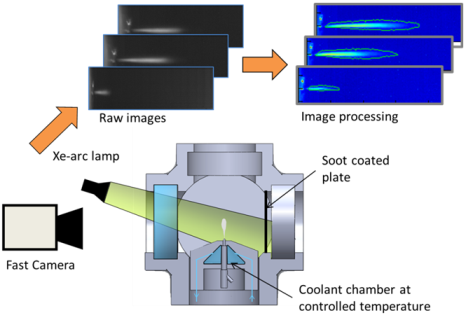
Temperature uniformity assesment
A continuous flow facility is available at CMT – Clean Mobility & Thermofluids to perform optical measurements under controlled test conditions. The test rig works at high pressure and high temperature (up to 950 K and 150 bar).
The operating condition were:
- Tempereture: 900 K
- Pressure: 60 bar
- Density 22.8 kg/m3

Prior to Spray “A” measurements, the temperature distribution inside the chamber was estimated.
- The temperature distribution in the testing section was measured and showed limited temperature fluctuations.
- The temperature is quite uniform even at locations close to the tip thus allowing for correct measurements of liquid length.

Temperature map [K] | |||
Y/X [mm] | 3 | 25 | 50 |
-12 | 893.8 | 893.8 | 897.4 |
-6 | 893.9 | 893.9 | 899.2 |
0 | 895.6 | 895.6 | 900.3 |
6 | 895.6 | 895.6 | 901.5 |
12 | 894.8 | 894.8 | 901.7 |
Temp. Std. Dev. Map [K] | |||
Y/X [mm] | 3 | 25 | 50 |
-12 | 1.3 | 1.1 | 1.1 |
-6 | 1.3 | 1.1 | 1.1 |
0 | 1.3 | 1.1 | 1.1 |
6 | 1.3 | 1.1 | 1.1 |
12 | 1.3 | 1.1 | 1.1 |
Temp. Uncertainty map [K] | |||
Y/X [mm] | 3 | 25 | 50 |
-12 | 4 | 2 | 2 |
-6 | 4 | 2 | 2 |
0 | 4 | 2 | 2 |
6 | 4 | 2 | 2 |
12 | 4 | 2 | 2 |
Nominal Operating conditions
| Nominal Spray A operating conditions of ECN | |
|---|---|
| Ambient gas temperature | 900 K |
| Ambient gas pressure | near 6.0 bar (600 kPa) |
| Ambient gas density | 22.8 kg/m3 |
| Ambient gas oxygen (by volume) | 0% (inert) and 15% (reacting) |
| Ambient gas velocity | Near-quiescent, less than 1 m/s |
| Fuel injection pressure | 150 MPa (1500 bar), prior to start of the injection |
| Fuel | n-dodecane |
| Fuel temperature at nozzle | 363 K (90 °C) |
Liquid phase penetration
Time-resolve liquid-length for sprays injected under evaporative conditions has been measured using two different techniques:
Mie scattering
Diffused back-illumination

Liquid length measured via Mie scattering at different test conditions

Results for 150 MPa injection pressure and discharge density of 22.8 kg/m3 (Spray A condition)

The complete methodology is described in:
- Payri, R., García-Oliver, J. M., Bardi, M. & Manin, J. (2012). Fuel temperature influence on diesel sprays in inert and reacting conditions. Applied Thermal Engineering 35 (0), 185 – 195
- R. Payri, F.J. Salvador, J. Gimeno, J. De la Morena, Influence of injector technology on injection and combustion development– Part 2: Combustion analysis, Applied Energy 88, p. 1130–1139, 2011.
- R. Payri, F.J. Salvador, J. Gimeno, L.D. Zapata, Diesel nozzle geometry influence on spray liquid-phase fuel penetration in evaporative conditions,Fuel 87, p. 1165–1176, 2008.
- J.M. Desantes, J.V. Pastor, R. Payri, J.M. Pastor, Experimental characterization of internal nozzle flow and diesel spray behavior. Part II: Evaporative conditions,Atomization and Sprays, 15, p. 517-543, 2005.
- F. Payri, R. Payri, M. Bardi, M. Carreres, Engine combustion network: Influence of the gas properties on the spray penetration and spreading angle, Experimental Thermal and Fluid Science 53, p. 236-243, 2014.
Valor-phase penetration (Schlieren)
High-speed Schlieren for sprays injected under evaporative conditions has been performed

Results for “spray A” condition

The complete methodology is described in:
- J.M. Desantes, J.V. Pastor, J.M. Garcia-Oliver, J.M. Pastor. A 1D model for the description of mixing-controlled reacting diesel sprays. Combustion and Flame 156 (2009) 234–249
- J.V. Pastor, J.M. García-Oliver, J.M. Pastor, J.-G. Nerva. A Study on Transient Flame Development. 2a Reunión de la Sección española del Instituto de Combustión,Valencia, 8-9 May 2008.
- J.V. Pastor, R. Payri, J.M. Garcia-Oliver, J.-G. Nerva, Schlieren Measurements of the ECN-Spray A Penetration under Inert and Reacting Conditions. SAE Technical Paper 2012-01-0456, 2012.
Lift-off length
ECN standard diagnostic (OH* chemiluminescence visualization) has been used


The complete methodology is described in:
- Jesús Benajes, Raúl Payri , Michele Bardi, Pedro Martí-Aldaraví, Experimental characterization of Diesel ignition and Lift-off length using a single-hole ECN injector, Applied Thermal Engineering, 10.1016/j.applthermaleng.2013.04.044.
- Payri, R., García-Oliver, J. M., Bardi, M. & Manin, J. (2012). Fuel temperature influence on diesel sprays in inert and reacting conditions. Applied Thermal Engineering 35 (0), 185 – 195.
- R. Payri, F.J. Salvador, J. Gimeno, J. De la Morena, Influence of injector technology on injection and combustion development– Part 2: Combustion analysis, Applied Energy 88, p. 1130–1139, 2011.
- R. Payri, F.J. Salvador, J. Gimeno, J. de la Morena, Effects of nozzle geometry on direct injection diesel engine combustion process, Applied Thermal Engineering, 29(10), p. 2051-2060, 2009.
Ignition delay
Ignition delay has been measured using the ECN standard technique: Broadband chemiluminescence
The complete methodology is described in:
- Jesús Benajes, Raúl Payri , Michele Bardi, Pedro Martí-Aldaraví, Experimental characterization of Diesel ignition and Lift-off length using a single-hole ECN injector, Applied Thermal Engineering, 10.1016/j.applthermaleng.2013.04.044.
- R. Payri, F.J. Salvador, J. Gimeno, J. De la Morena, Influence of injector technology on injection and combustion development– Part 2: Combustion analysis, Applied Energy, 2010.
- R. Payri, F.J. Salvador, J. Gimeno, J. de la Morena, Effects of nozzle geometry on direct injection diesel engine combustion process, Applied Thermal Engineering, 29(10), p. 2051-2060, 2009.
Near Field Visualization
Liquid phase near field was measured with a DBI setup and a long-distance microscope. Only the first 6 mm of penetration was visualized. Movies were recorded at 120 kfps with a pixel-to-mm ratio of 73, the LED pulse length was set to 125 nanoseconds. A parametric variation of injection pressure and chamber density was carried out following ECN guidelines.

Liquid phase penetration was measured and compared between nozzles. In general, Spray B showed lower liquid phase penetration for all conditions, probably caused by lower sac pressure due to the number of holes, or complexities in the internal flow development.

Spreading angle was measured as the angle between two linear fits calculated, for a top and bottom profile of the spray, at intervals of 1 and 5 mm of the spray tip penetration. The temporal results were averaged in the stabilized region to obtain a single value of spreading angle.

The spray axis angle is defined as the measured angle between the averaged spray axis (throughout the whole injection event) and the axis formed between the nozzle exit and the spray centroid for a single frame. The spray axis fluctuation is obtained by calculating the standard deviation of the temporal spray axis angle, the value is multiplied by two to calculated peak-to-peak fluctuations. Higher values obtained for the Spray B nozzle could be due to incipient cavitation, higher turbulence conditions at the outlet of the nozzle or singular vapor pockets at the exit of the nozzle. Further CFD analysis is required to fully understand this phenomenon.

Reactive Spray Visualization
Ignition delay and lift-off length were measured in the Spray B using Schlieren Visualization and OH* chemiluminescence, respectively. Ignition delay can be calculated with Schlieren imaging by analyzing the rate of growth of the spray. This decreases in the cool flame or first stage ignition, due to density similarities between the combustion zone and the surroundings. Afterwards, during the second stage ignition, there is a sharp increase in the rate of growth, due to the sudden expansion of the gases and rapid change in density of the reaction zone. Lift-off length was measured with standard ECN methodology.

A parametric sweep of three different chamber temperatures (800K, 820K and 900K), three injection pressures (500 bar, 1000 bar and 1500 bar) and 5 different oxygen concentrations (13%, 15%, 17%, 19% and 21%vol) was carried out. All measurements were done at a fix density of 22.8 kg/m3. Spray A ignition delay and lift-off length data were obtained from a previous measurement campaign.


Differences between nozzles can be attributed to multiple factors, Spray B presumably has a higher turbulence at the outlet of the nozzle, improving mixing and thus reducing both ignition delay and lift-off length. Also, the fuel is injected to different regions of the combustion chamber, thus temperature distribution becomes a crucial factor.

The complete methodology is described in:
- R. Payri, F. J. Salvador, J. Manin, A. Viera. Diesel ignition delay and lift-off length through different methodologies using a multi-hole injector, Applied Energy 162, 2016, 541–550. doi: 10.1016/j.apenergy.2015.10.118.
- R. Payri, G. Bracho, P. Martí-Aldavarí, A. Viera. Near field visualization for different nozzle inclination angles in non-vaporizing conditions, Atomization and Sprays 27, 2017, 251-267, doi: 10.1615/AtomizSpr.2017017949.
- Jesús Benajes, Raúl Payri , Michele Bardi, Pedro Martí-Aldaraví, Experimental characterization of Diesel ignition and Lift-off length using a single-hole ECN injector, Applied Thermal Engineering, 10.1016/j.applthermaleng.2013.04.044.
Nominal Operating conditions
| Spray G operating conditions of ECN | |
|---|---|
| Ambient gas temperature | 300 °C (573 K) |
| Ambient gas pressure a | near 6.0 bar (600 kPa) |
| Ambient gas density a | 3.5 kg/m3 |
| Ambient gas oxygen (by volume) | 0% O2 (non-reacting). ( ) |
| Ambient gas velocity | Near-quiescent, less than 1 m/s |
| Fuel injector | Delphi solenoid-activated |
| Nozzle | 8-hole ( 8-hole ( see detailed nozzle geometry)) |
| Fuel injection pressure | 20 MPa (200 bar), prior to start of the injection |
| Fuel | Iso-octane |
| Fuel temperature at nozzle b | 363 K (90 °C) |
| Injection mass | 10 mg* |
| Electronic injection duration | 680 µs |
| Actual injection duration | 780 µs (see actual measured injection duration) |
| Measured needle lift | Argonne x-ray data |
a This exact combination of ambient pressure and density corresponds to a particular set of gases for a 0%-O2 condition with 89.71% N2, 6.52% CO2, and 3.77% H2O by volume. When different gases are used, the pressure must vary to maintain the same density.
b May be slightly different than injector body temperature.
* Indicates a nominal value
Liquid length
Time-resolve liquid-length for sprays injected under evaporative conditions has been measured using.
Diffused back-illumination

DBI is the standard methodology for liquid determination in the ECN

Image description:
- Original
- Background subtraction
- Thresholding
- Cleaning
- Detected contour
- Original + detected border
Differences between DBI and Schlieren processing
- Background subtraction: Static/dynamic
- Threshold: Optical thickness/ Fixed threshold
Experimental methodology
Five fuels with different characteristics were tested in the HPHT facility under the same thermodynamic conditions. Two renewable fuels were tested, namely Hydrotreated Vegetable Oil (HVO) and two oxymethylene dimethyl ethers (OME), with the general structure CH3–O–(CH2–O)n–CH3. The first one was a single component one corresponding to the shortest carbon chain (n = 1) of the family, it will be denoted here as OME1Five fuels with different characteristics were tested in the HPHT facility under the same thermodynamic conditions. Two renewable fuels were tested, namely Hydrotreated Vegetable Oil (HVO) and two oxymethylene dimethyl ethers (OME), with the general structure CH3–O–(CH2–O)n–CH3. The first one was a single component one corresponding to the shortest carbon chain (n = 1) of the family, it will be denoted here as OMEx. Additionally, two reference fuels were chosen, namely regular Diesel and n-dodecane, the latter one being the reference for Engine Combustion Network. Fuel properties are shown in the following table.
| Characteristics | Diesel | dodecane | HVO | OME1 | OMEx |
|---|---|---|---|---|---|
| Density [kg/m3] (T= 15 °C) | 835.2 | 751.2 | 779.1 | 866.7 | 1057.1 |
| Viscosity [mm2/s] (T= 40 °C) | 2.8 | 1.4 | 2.7 | 0.3 | 1.0 |
| Cetane number [-] | 54.1 | 74 | 75.5 | 28 | 68.6 |
| Lubricity [µm] | 386 | 563 | 316 | 747 | 320 |
| Flash point [ºC] | - | 83 | 70 | <40 | 65 |
| Lower heating value [MJ/kg] | 39.8 | 44.2 | 43.9 | 19.2 | 19.2 |
| Initial Boiling Point [ºC] | 155.1 | 214.0 | 185.5 | 37.4 | 144.9 |
| Final Boiling Point [ºC] | 363.1 | 218 | 302 | 38 | 242.4 |
| (A/F)st at 21% of O2 | 14.4 | 14.9:1 | 14.5:1 | 7.2:1 | 5.9:1 |
| (A/F)st at 15% of O2 | 19.9 | 20.7:1 | 20.2:1 | 10.0:1 | 8.1:1 |
Thermodynamic condition are depicted in the following table, bold letters represents the nominal condition
| Oxygen concentration (%) | Temperature [K] | Injection Pressure [bar] |
|---|---|---|
| 15 21 | ||
| 800 | 500 | |
| 900 | 1000 | |
| 1000 | 1500 |
All fuels were studied under the thermodynamic conditions above mentioned for two nozzles with the following actual diameter.
| Actual nozzle diameter [µm] |
|---|
| 89.4 (Spray A – Nozzle 210675) |
| 190.3 (Spray A – Nozzle 209135) |
Four optical techniques were implemented simultaneously in two different experimental layouts. In the first set, Schlieren, OH* chemiluminescence and Natural Luminosity (NL) were used. In the second set: Diffused Back Illumination (DBI) and OH* chemiluminescence again. The optical set up is shown below:

Ignition Delay (ID) can be obtained from Schlieren images and OH*. Both results have been compared to confirm that they are equivalent as it is shown in the following graph

Results. Combustion parameters
The vapor penetration and ID have been measured from schlieren images and LOL from OH* chemiluminescence. The standard deviation for each parameter is represented by shaded areas. A first stage from start of injection until ignition can be observed, where vapor penetration is identical for all the fuels. Only at certain time after ignition differences appear. This first stage corresponds to the ignition delay phase, which extends for each fuel until combustion starts. The ignition delay time has been marked in the figure as a dashed vertical line for each fuel. During the period until ignition, no fuel effects are seen on the spray behavior, because the penetration is governed by the momentum flux at the nozzle which only depends on the pressure drop across the nozzle and on the orifice area, fuel effects are negligible. In addition, the effect of the different fuels upon the indicated parameters can be observed. The dashed-dot horizontal lines correspond to the temporal evolution of LOL. After the ignition, the fuel that ignites first penetrates faster than the others do. In general, it is possible to see that while OMEx has similar behavior to the reference fuels and HVO, OME1 is quite far from them.

Soot behavior
KL distribution is shown for nominal operating condition, which represents the quasi-steady combustion phase for all fuel (between 3ms and 4 ms). Not enough signal was found for OME1 and OMEx, which confirms that these are non-sooting fuels. The most sooting fuel is diesel, followed by dodecane and then HVO as the less sooting fuel of these three.

Full analysis of this parameters can be found in the following references:
[1] Pastor, J.V.; García-Oliver, J.M.; Micó, C.; García-Carrero, A.A.; Gómez, A. Experimental Study of the Effect of Hydrotreated Vegetable Oil and Oxymethylene Ethers on Main Spray and Combustion Characteristics under Engine Combustion Network Spray A Conditions. Appl. Sci. 2020, 10, 5460. https://doi.org/10.3390/app10165460
[2] Pastor, J.V.; García-Oliver, J.M.; Micó, C.; García-Carrero, A.A . An experimental study with renewable fuels using ECN Spray A and D nozzles. Submitted to International Journal of Engine Research, 2021
This research has been partly funded by the European Union’s Horizon 2020 Programme through the ENERXICO project, grant agreement n◦ 828947, and from the Mexican Department of Energy, CONACYT-SENER Hidrocarburos grant agreement n◦ B-S-69926.
Spray A Hydraulic characterization
Sample of momentum flux measurements for Spray A

Download file with spray momentum rate results
Effective velocity and area can be calculated from spray momentum and mass flow rate Velocity and area coefficients can be obtained using theoretical velocity and geometric
Sample of momentum flux measurements for Spray A

Methodology summary for hydraulic characterization
Results of the hydraulic characterization of the ECN injector.
| Data recompilation | Value | Units |
|---|---|---|
| Orifice diameter | 89.4 | µm |
| Injected mass | 3.72 | mg/st |
| Steady mass flow | 2.56 | g/s |
| Steady momentum flux | 1.50 | N |
| Discharge coefficient Cd | 0.9 | - |
| Area coefficient Ca | 0.98 | - |
| Velocity coefficient Cv | 0.92 | - |
| Momentum coefficient Cm | 0.83 | - |
The methodology to extract hydraulic coefficients is described in:
- R. Payri, J.M.Garcia, F.J. Salvador, J. Gimeno, Using spray momentum flux measurements to understand the influence of diesel nozzle geometry on spray characteristics, Fuel 84, p. 551-561, 2005.
Spray B Rate of injection
Rate of injection results are for the Spray B Nozzle 211200. Measurements were carried out with n-Dodecane.


Rate of injection for Spray B nozzles.
To generate the ROI of a particular nozzle orifice, you must multiply the nominal mass flow of the corresponding nozzle orifice by the normalized non-dimensional shape of ROI.
ROI = mass_flow * non-dim_ROI
The reference values of all nozzles can be downloaded here.
The normalized non-dimensional shape of ROI (injection duration = 1.5ms) can be downloaded here.
Note: This is a preliminary version. Both non-dimensional shape of ROI, and reference values can be change in the future just as more information about injector will be known
Spray C / D Rate of injection
Rate of injection for Spray C/D nozzles.
To generate the ROI of a particular nozzle orifice, you must multiply the nominal mass flow of the corresponding nozzle orifice by the normalized non-dimensional shape of ROI.
ROI = mass_flow * non-dim_ROI
The reference values of all nozzles for n-dodecane can be downloaded here.
The normalized non-dimensional shape of ROI (long injection duration) can be downloaded here.
| Spray C | Spray D |
| 50MPa | 50MPa |
| 100MPa | 100MPa |
| 150MPa | 150MPa |
Valid for nominal points: Prail = 50MPa, 100MPa, 150MPa, Pback = 6MPa
The results are presented in:
-Payri, R., Gimeno, J., Cuisano, J., & Arco, J. (2016). Hydraulic characterization of diesel engine single-hole injectors. Fuel, 180, 357–366. http://doi.org/10.1016/j.fuel.2016.03.083
Spray G
Rate of injection.

Momentum flux..
Two configurations were used for momentum flux measurement: Lateral configuration and frontal configuration


Frontal configuration provides more consistent results, linear tendency with delta P.
The complete methodology is described in:
- Payri, R., Gimeno, J., Marti-Aldaravi, P., Vaquerizo, D., 2015. Momentum Flux Measurements on an ECN GDi Injector. SAE Tech. Pap. 2015-01-1893. doi:10.4271/2015-01-1893
- Payri, R., Gimeno, J., Martí-Aldaraví, P., Vaquerizo, D., Internal flow characterization on an ECN GDi injector. At. Sprays 26, 889–919. doi:10.1615/AtomizSpr.2015013930
Inert Spray Results
Isothermal / Evaporative Comparision
Liquid Lenght results
Vapor penetration results
Reacting Spray results
Spreadsheet with global combustion parameters here.
Image sample (*) Pixmm = 5.85; Tip position (pixel coordinates) : [65; 95]
The results are presented in the work by Benajes et al.
- Jesús Benajes, Raúl Payri , Michele Bardi, Pedro Martí-Aldaraví, Experimental characterization of Diesel ignition and Lift-off length using a single-hole ECN injector, Applied Thermal Engineering, 10.1016/j.applthermaleng.2013.04.044
Enerxico database
In this section experimental data of five fuels are available: Dodecane, Diesel, HVO, OME1 and OMEx. These fuels have been studied using Spray A and Spray D at constant ambient density 22.8 kg/m3. Different temperatures: 800 K, 900 K, 950 K and 1000 K, injection pressure: 500 bar, 1000 bar and 1500 bar and two oxygen concentration: 12% and 21% (vol.) were tested.
Mean parameters such as Ignition delay (ID) and Lift-off length (LOL) are shown on a tabular form together with their standard deviation. Furthermore, a file can be downloaded for each condition with the temporal evolution of average vapor penetration, OH* penetration, flame penetration, LOL and soot mass together with their standard deviation and the confidence interval of the average at 95%.
For further info on the database please contact jgarciao@mot.upv.es.
Values showing -999 correspond to condition where no combustion was measured.
| Diesel | SA | 21 | 800 | 500 | 1.454 | 0.111 | 23.729 | 1.833 | DOWNLOAD |
| Diesel | SA | 21 | 800 | 1000 | 1.370 | 0.082 | 32.363 | 2.044 | DOWNLOAD |
| Diesel | SA | 21 | 800 | 1500 | 1.449 | 0.106 | 39.125 | 3.055 | DOWNLOAD |
| Diesel | SA | 21 | 900 | 500 | 0.544 | 0.044 | 15.361 | 0.686 | DOWNLOAD |
| Diesel | SA | 21 | 900 | 1000 | 0.447 | 0.032 | 17.204 | 0.956 | DOWNLOAD |
| Diesel | SA | 21 | 900 | 1500 | 0.440 | 0.026 | 19.019 | 1.018 | DOWNLOAD |
| Diesel | SA | 21 | 950 | 500 | 0.423 | 0.021 | 12.988 | 0.474 | DOWNLOAD |
| Diesel | SA | 21 | 950 | 1000 | 0.349 | 0.036 | 14.575 | 0.701 | DOWNLOAD |
| Diesel | SA | 21 | 950 | 1500 | 0.337 | 0.027 | 16.742 | 0.989 | DOWNLOAD |
| Diesel | SD | 21 | 800 | 500 | 1.517 | 0.207 | 36.125 | 4.944 | DOWNLOAD |
| Diesel | SD | 21 | 800 | 1000 | 1.726 | 0.165 | 57.238 | 3.649 | DOWNLOAD |
| Diesel | SD | 21 | 800 | 1500 | 1.675 | 0.122 | 63.217 | 3.600 | DOWNLOAD |
| Diesel | SD | 21 | 900 | 500 | 0.632 | 0.044 | 20.861 | 0.727 | DOWNLOAD |
| Diesel | SD | 21 | 900 | 1000 | 0.593 | 0.047 | 24.184 | 1.446 | DOWNLOAD |
| Diesel | SD | 21 | 900 | 1500 | 0.528 | 0.039 | 25.268 | 1.348 | DOWNLOAD |
| Diesel | SD | 21 | 950 | 500 | 0.437 | 0.039 | 16.622 | 0.728 | DOWNLOAD |
| Diesel | SD | 21 | 950 | 1000 | 0.404 | 0.021 | 19.490 | 0.820 | DOWNLOAD |
| Diesel | SD | 21 | 950 | 1500 | 0.395 | 0.018 | 21.263 | 0.978 | DOWNLOAD |
| Diesel | SD | 15 | 800 | 500 | 1.624 | 0.115 | 32.772 | 1.373 | DOWNLOAD |
| Diesel | SD | 15 | 800 | 1000 | 1.291 | 0.113 | 34.669 | 5.194 | DOWNLOAD |
| Diesel | SD | 15 | 800 | 1500 | 1.499 | 0.159 | 46.040 | 2.513 | DOWNLOAD |
| Diesel | SD | 15 | 900 | 500 | 0.739 | 0.031 | 21.579 | 1.781 | DOWNLOAD |
| Diesel | SD | 15 | 900 | 1000 | 0.610 | 0.027 | 26.128 | 1.225 | DOWNLOAD |
| Diesel | SD | 15 | 900 | 1500 | 0.617 | 0.033 | 30.545 | 1.449 | DOWNLOAD |
| Diesel | SD | 15 | 1000 | 500 | 0.464 | 0.020 | 16.690 | 0.634 | DOWNLOAD |
| Diesel | SD | 15 | 1000 | 1000 | 0.418 | 0.016 | 19.468 | 1.324 | DOWNLOAD |
| Diesel | SD | 15 | 1000 | 1500 | 0.411 | 0.021 | 22.200 | 0.873 | DOWNLOAD |
| Diesel | SA | 15 | 800 | 500 | 1.664 | 0.251 | 31.798 | 2.787 | DOWNLOAD |
| Diesel | SA | 15 | 800 | 1000 | 1.404 | 0.121 | 36.648 | 2.214 | DOWNLOAD |
| Diesel | SA | 15 | 800 | 1500 | 1.389 | 0.121 | 40.580 | 2.792 | DOWNLOAD |
| Diesel | SA | 15 | 900 | 500 | 0.550 | 0.029 | 21.499 | 1.162 | DOWNLOAD |
| Diesel | SA | 15 | 900 | 1000 | 0.481 | 0.016 | 23.828 | 0.955 | DOWNLOAD |
| Diesel | SA | 15 | 900 | 1500 | 0.462 | 0.022 | 25.673 | 1.158 | DOWNLOAD |
| Diesel | SA | 15 | 1000 | 500 | 0.354 | 0.013 | 16.067 | 0.487 | DOWNLOAD |
| Diesel | SA | 15 | 1000 | 1000 | 0.370 | 0.019 | 18.903 | 0.617 | DOWNLOAD |
| Diesel | SA | 15 | 1000 | 1500 | 0.325 | 0.009 | 20.341 | 0.768 | DOWNLOAD |
| Dodecane | SA | 21 | 800 | 1500 | 1.090 | 0.165 | 26.762 | 2.691 | DOWNLOAD |
| Dodecane | SA | 21 | 900 | 500 | 0.494 | 0.037 | 12.216 | 0.436 | DOWNLOAD |
| Dodecane | SA | 21 | 900 | 1000 | 0.412 | 0.044 | 13.613 | 0.710 | DOWNLOAD |
| Dodecane | SA | 21 | 900 | 1500 | 0.370 | 0.033 | 14.304 | 0.679 | DOWNLOAD |
This research has been partly funded by the European Union’s Horizon 2020 Programme through the ENERXICO project, grant agreement n◦ 828947, and from the Mexican Department of Energy, CONACYT-SENER Hidrocarburos grant agreement n◦ B-S-69926.
1D SPRAY MODEL DICOM
DICOM is a one-dimensional (1D) spray model that predicts the evolution of a turbulent jet under some simplifying hypotheses. Scientific basis for the model can be found in [1-4]. The model can be used to estimate penetration and mixing of sprays under both inert and reacting conditions.
An updated version is available (April 24th 2023) including the following features:
- Inputs to the model are stored into a text file with .dic extension.
- Single- or multi-component fuels can be calculated [4].
- Fuel properties can be changed and instructions on how to add new fuels are provided.
SOURCE CODE HAS BEEN MADE AVAILABLE AT GITLAB
REFERENCES
[1] Pastor J.V., López J.J., Garcia-Oliver J.M., Pastor J.M., “A 1D model for the description of mixing-controlled inert diesel sprays”, Fuel 87 (2008) 2871-2885
[2] Desantes J.M., Pastor J.V., Garcia-Oliver J.M., Pastor J.M., “A 1D model for the description of mixing-controlled reacting diesel sprays”, Combustion and Flame 156 (2009) 234–249
[3] Pastor, J., Payri, R., Garcia-Oliver, J., and Nerva, J., Schlieren Measurements of the ECN-Spray A Penetration under Inert and Reacting Conditions, SAE Technical Paper 2012-01-0456, 2012
[4] Pastor, J., Garcia-Oliver, J., Pastor, J.M. and Vera-Tudela, W., “One- Dimensional Diesel Spray Modeling of Multicomponent Fuels”, Atomization and Sprays, in press, 2015, DOI 10.1615/AtomizSpr.2014010370
CREDITS
The model was originally programmed in 2006 by A. Sanchis Boscá and J.M. García-Oliver. We acknowledge contributions to model extensions by the following PhD Students:
- W. Vera-Tudela Fajardo (multi-component evaporation)
- Jiawei Cao (quasi-1D combustion)
We also acknowledge the relevant colaborations from the following former CMT students:
- M. C. Saiz Egea
- B. Martínez González
- G. Coumes
- W. Villafana
- M. Palau Fernández
- R. Colomina Salazar
- J. Mora Morató